Linear functions are everywhere around you - from calculating your...
Exploring Linear Functions: Graphing and Relationships


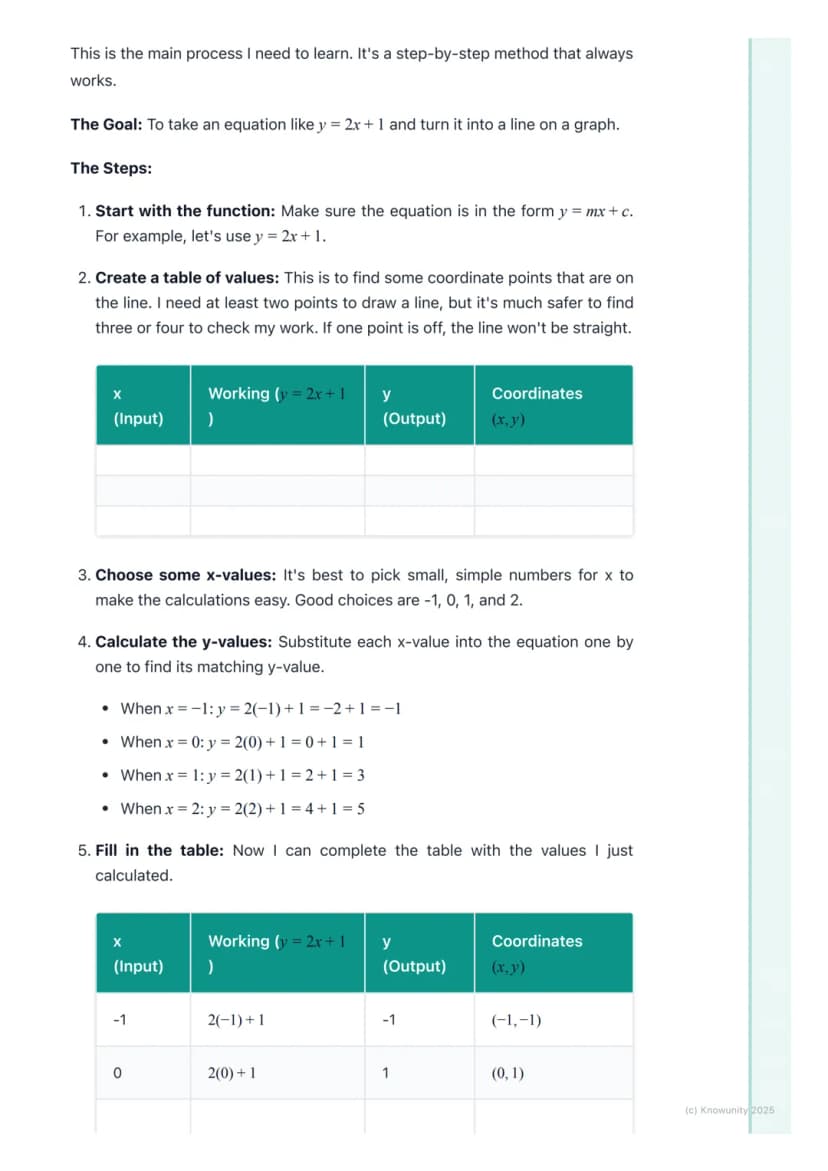
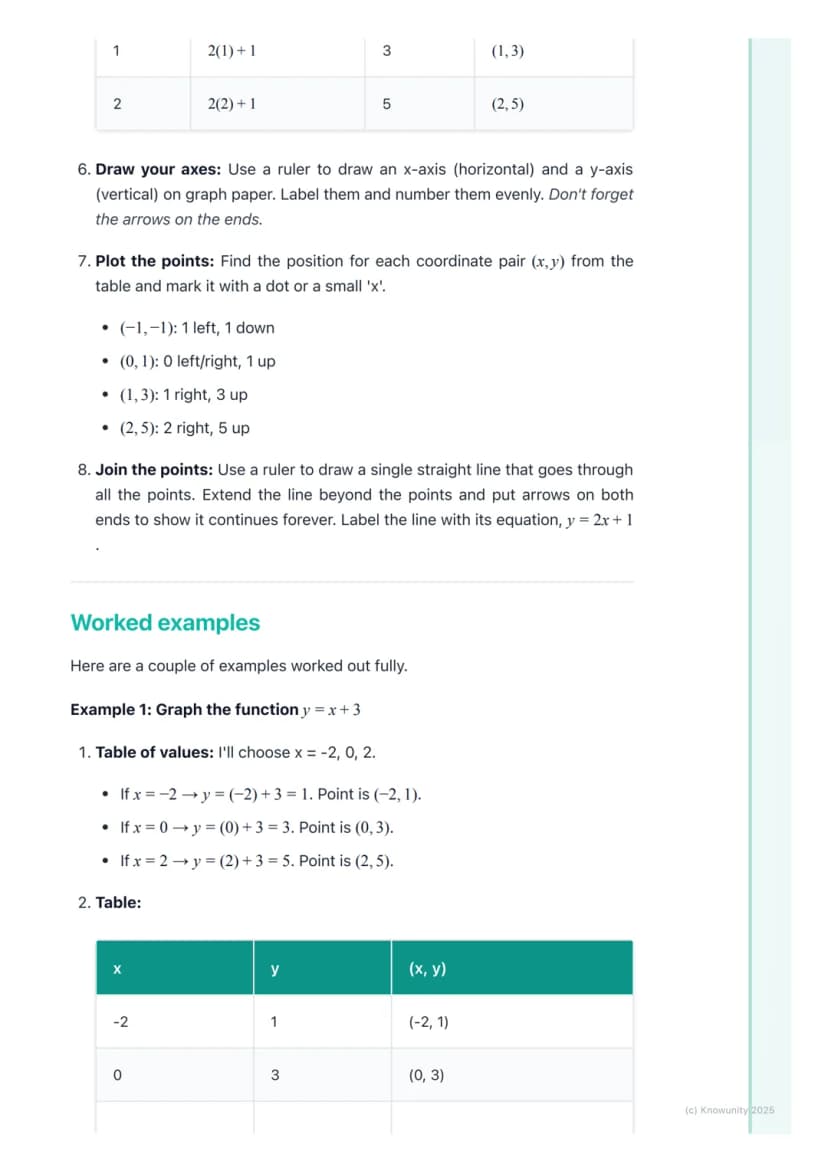

1 / 7
1
of 7
Understanding Linear Functions
Think of a linear function as a mathematical rule that always creates a straight line when you plot it on a graph. The clue's in the name - "linear" comes from "line"! These functions show how two things are connected in a steady, predictable way.
The magic formula you need to master is y = mx + c. This might look intimidating at first, but it's actually your best friend for understanding how lines work. Every linear function can be written this way.
You'll also need to get comfortable with some key vocabulary. A function is simply a rule that takes one number (x) and gives you exactly one answer (y). Variables are the letters (like x and y) that can change, while constants are the numbers that stay the same. Coordinates are pairs of numbers like (3, 4) that tell you exactly where to put a point on your graph.
Quick Tip: Remember coordinates as "across the hall, then up the stairs" - go across the x-axis first, then up or down the y-axis!
2
of 7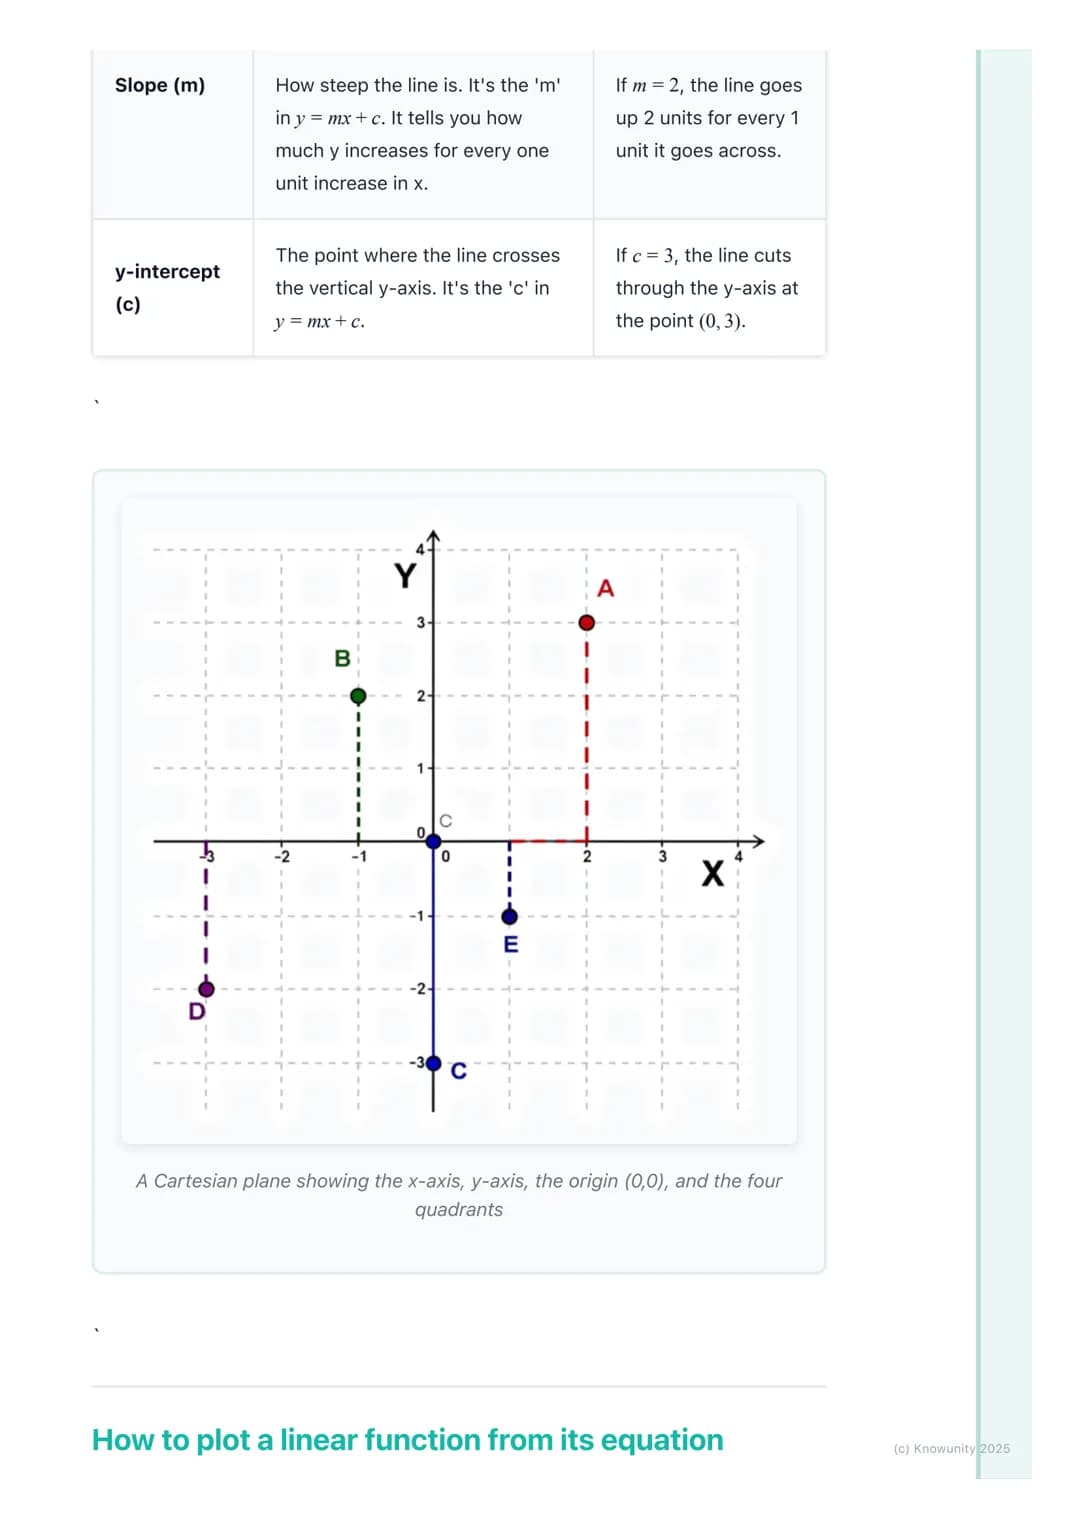
The Two Most Important Parts
Every linear equation has two crucial components that control how your line looks. The slope (m) tells you how steep your line is - it's like the angle of a ramp. If m = 2, your line goes up 2 units for every 1 unit it goes across. Pretty straightforward!
The y-intercept (c) is where your line crosses the vertical y-axis. If c = 3, you know your line will pass through the point (0, 3) every single time. This gives you an instant starting point for drawing your graph.
Understanding these two parts means you can look at any equation like y = 2x + 1 and immediately know: "This line has a slope of 2 and crosses the y-axis at 1." You're already halfway to drawing the perfect graph!
Remember: Positive slopes go uphill from left to right, negative slopes go downhill. It's that simple!
3
of 7
Creating Your Table of Values
Here's where the real work begins, but don't worry - it's just following a recipe. Start with your linear function in the form y = mx + c. Let's use y = 2x + 1 as our example.
Your mission is to find at least three points that lie on this line. Pick simple x-values like -1, 0, 1, and 2 to make your calculations easy. Nobody wants to work with horrible fractions when they don't have to!
Now substitute each x-value into your equation. When x = 0: y = 2(0) + 1 = 1. When x = 1: y = 2(1) + 1 = 3. When x = 2: y = 2(2) + 1 = 5. See the pattern? Your y-values are increasing by 2 each time because your slope is 2.
Pro Tip: If your three points don't line up perfectly when you plot them, check your maths - one of your calculations has gone wrong!
4
of 7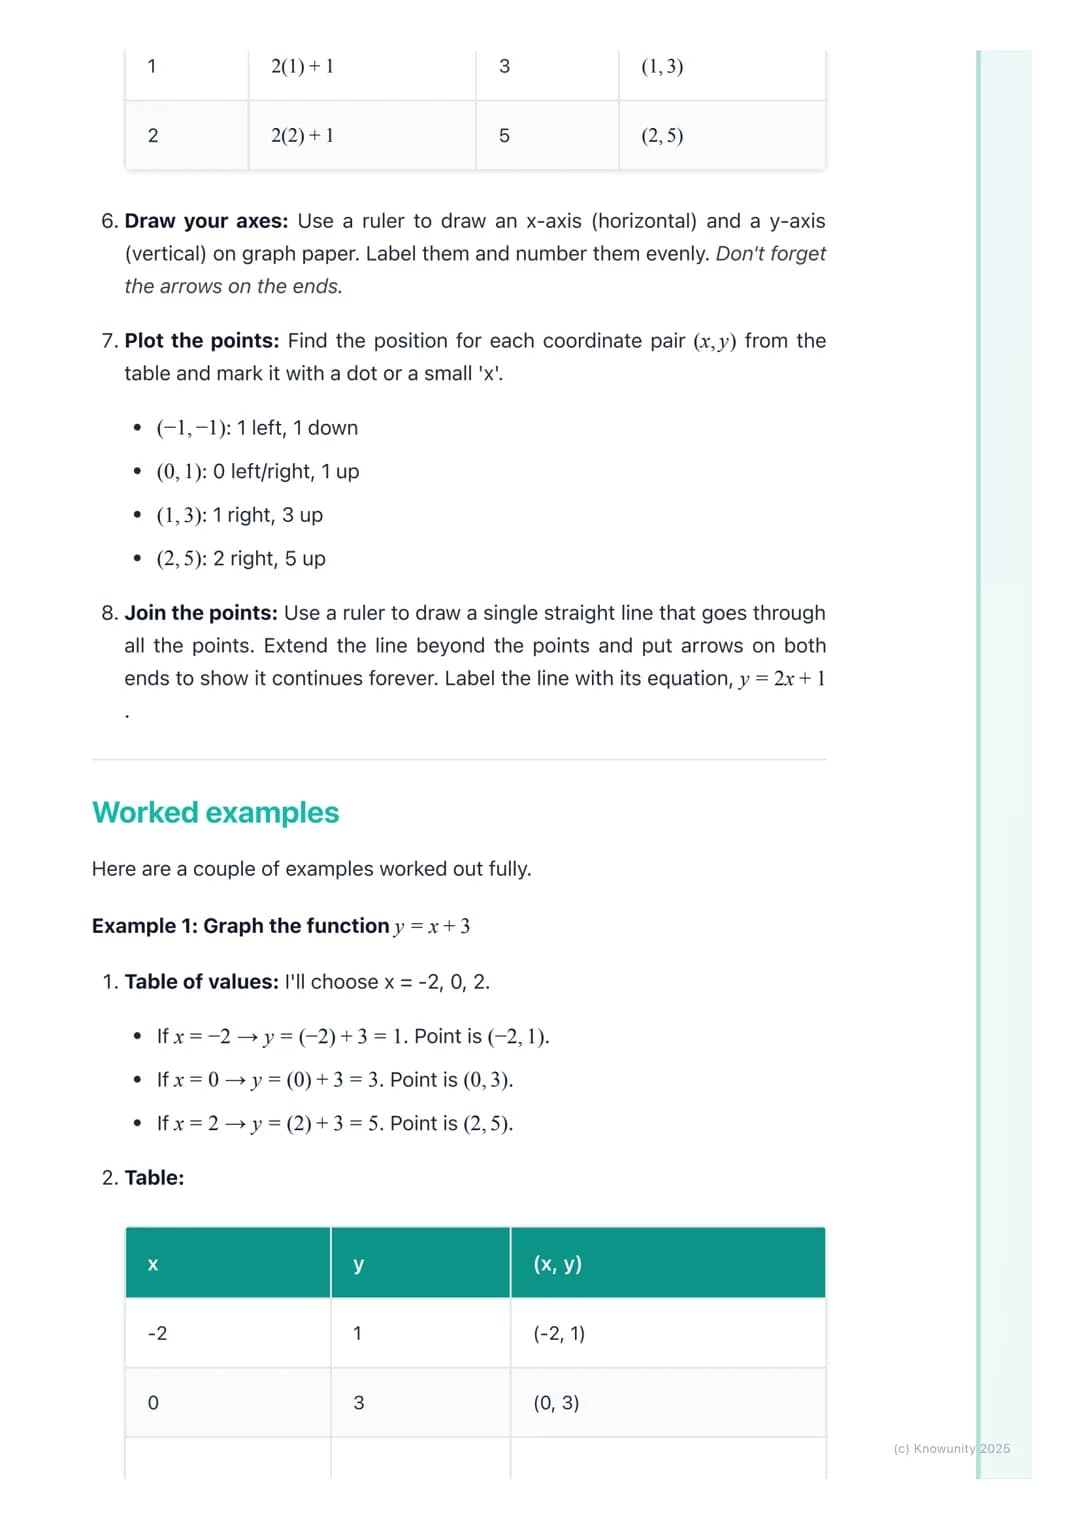
Plotting and Drawing Your Graph
Time to bring your calculations to life! Draw your axes with a ruler , label them clearly, and don't forget those arrows on the ends. Your Cartesian plane should look professional.
Plot each coordinate pair from your table carefully. For (-1, -1), go 1 unit left and 1 unit down from the origin. For (0, 1), stay on the y-axis and go 1 unit up. For (1, 3), go 1 unit right and 3 units up.
Once all your points are marked, use your ruler to draw one straight line through them all. Extend the line beyond your points with arrows to show it continues forever. Label your line with its equation - teachers love to see this attention to detail.
Golden Rule: Three points minimum! Two points make a line, but the third point proves you haven't made any mistakes.
5
of 7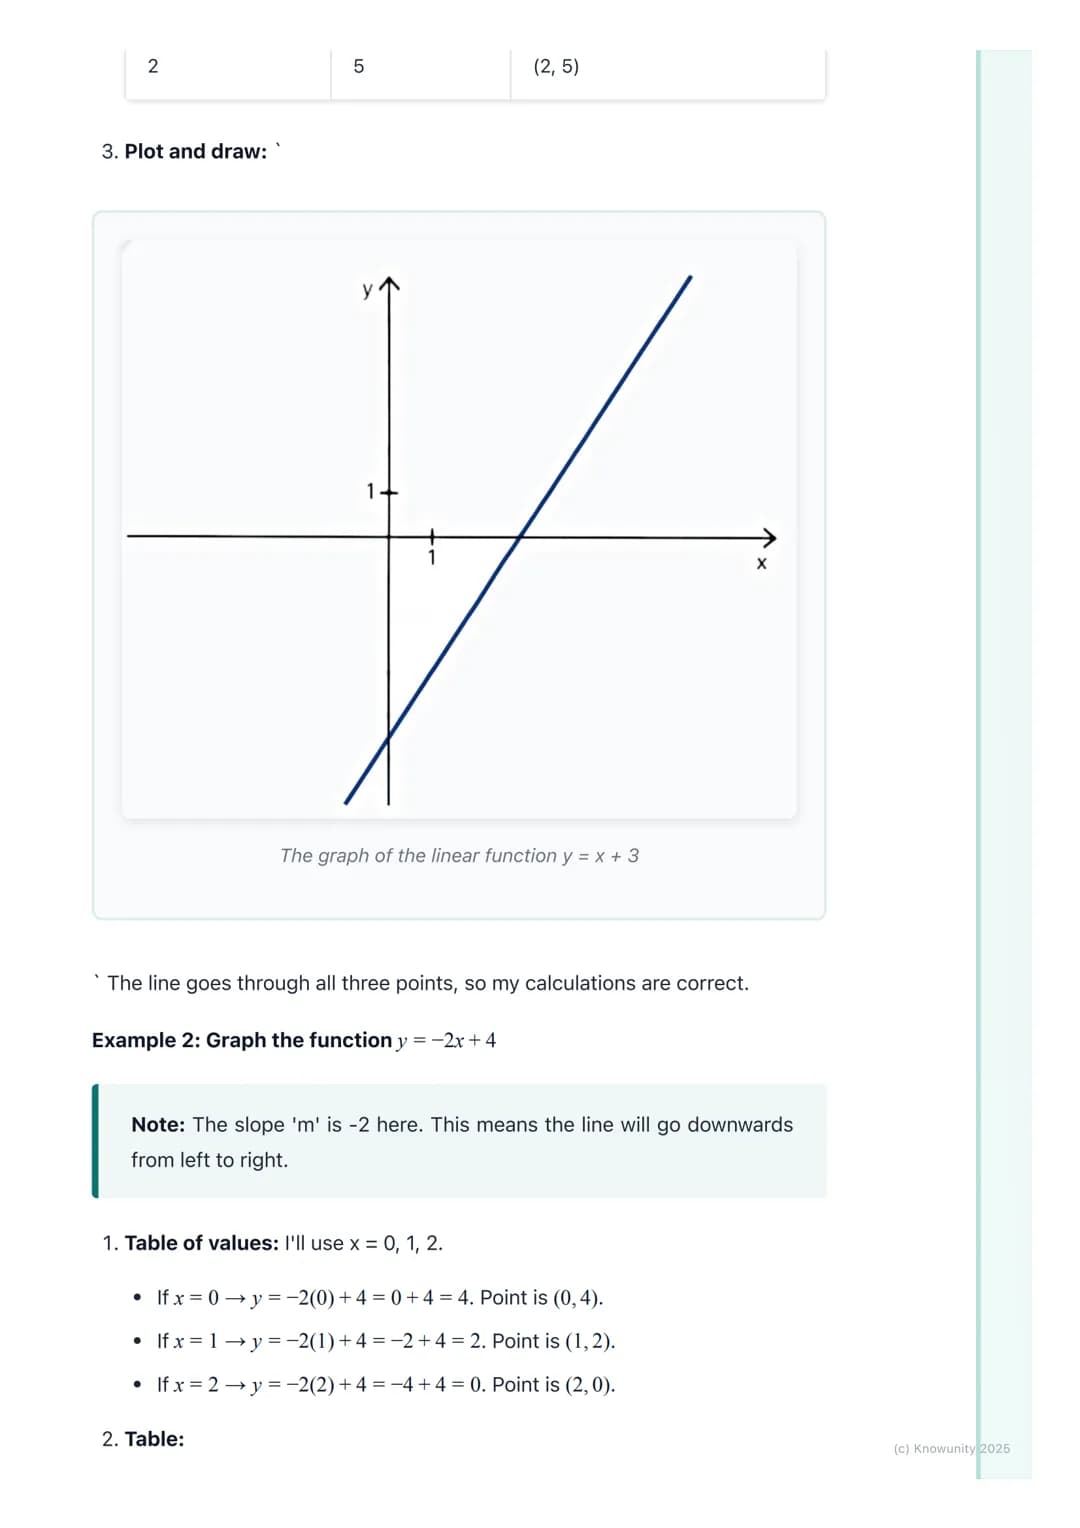
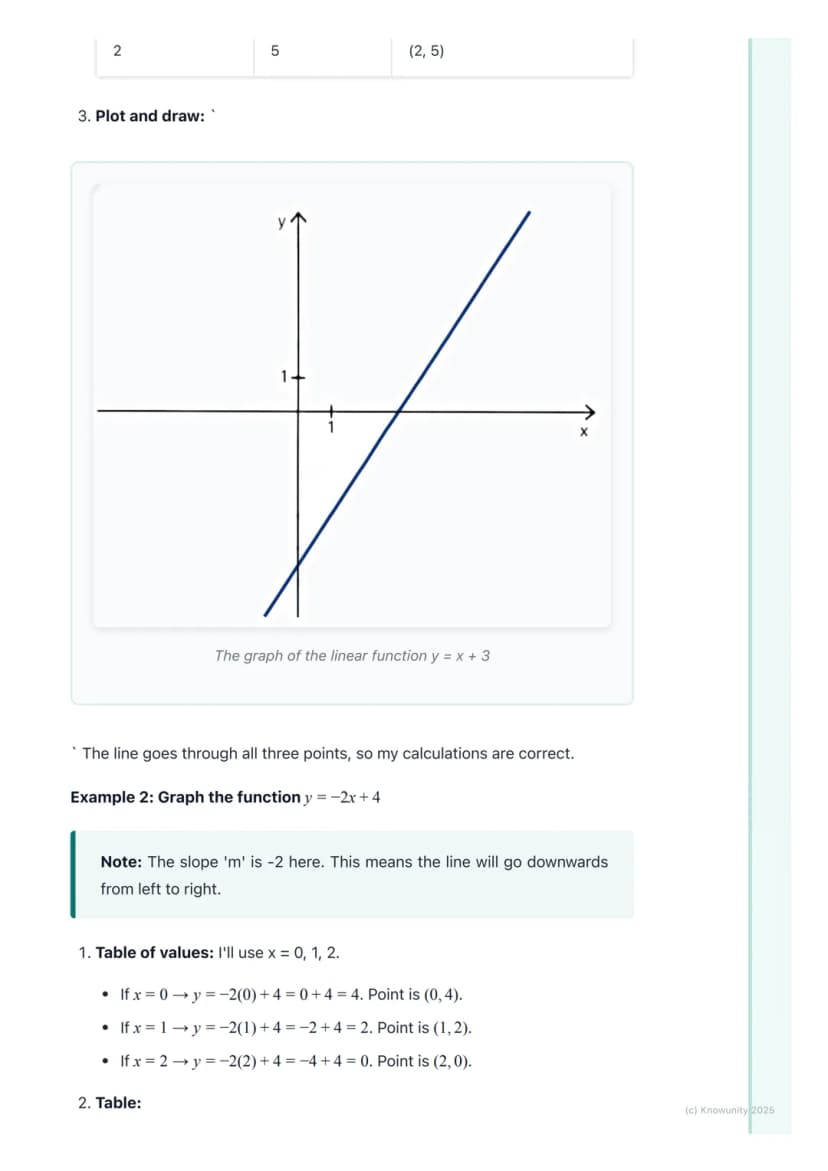
Worked Example: Positive Slope
Let's tackle y = x + 3 step by step. This linear function has a slope of 1 (remember, x means 1x) and a y-intercept of 3. So you know it goes up gently and crosses the y-axis at 3.
Choose x = -2, 0, and 2 for easy calculations. When x = -2: y = (-2) + 3 = 1. When x = 0: y = (0) + 3 = 3. When x = 2: y = (2) + 3 = 5. Your coordinates are (-2, 1), (0, 3), and (2, 5).
Plot these points and connect them with a straight line. Notice how the line goes up from left to right? That's because your slope is positive. The line crosses the y-axis exactly where you predicted - at y = 3.
Check Yourself: Does your line pass through (0, 3)? If not, something's gone wrong with your plotting!
6
of 7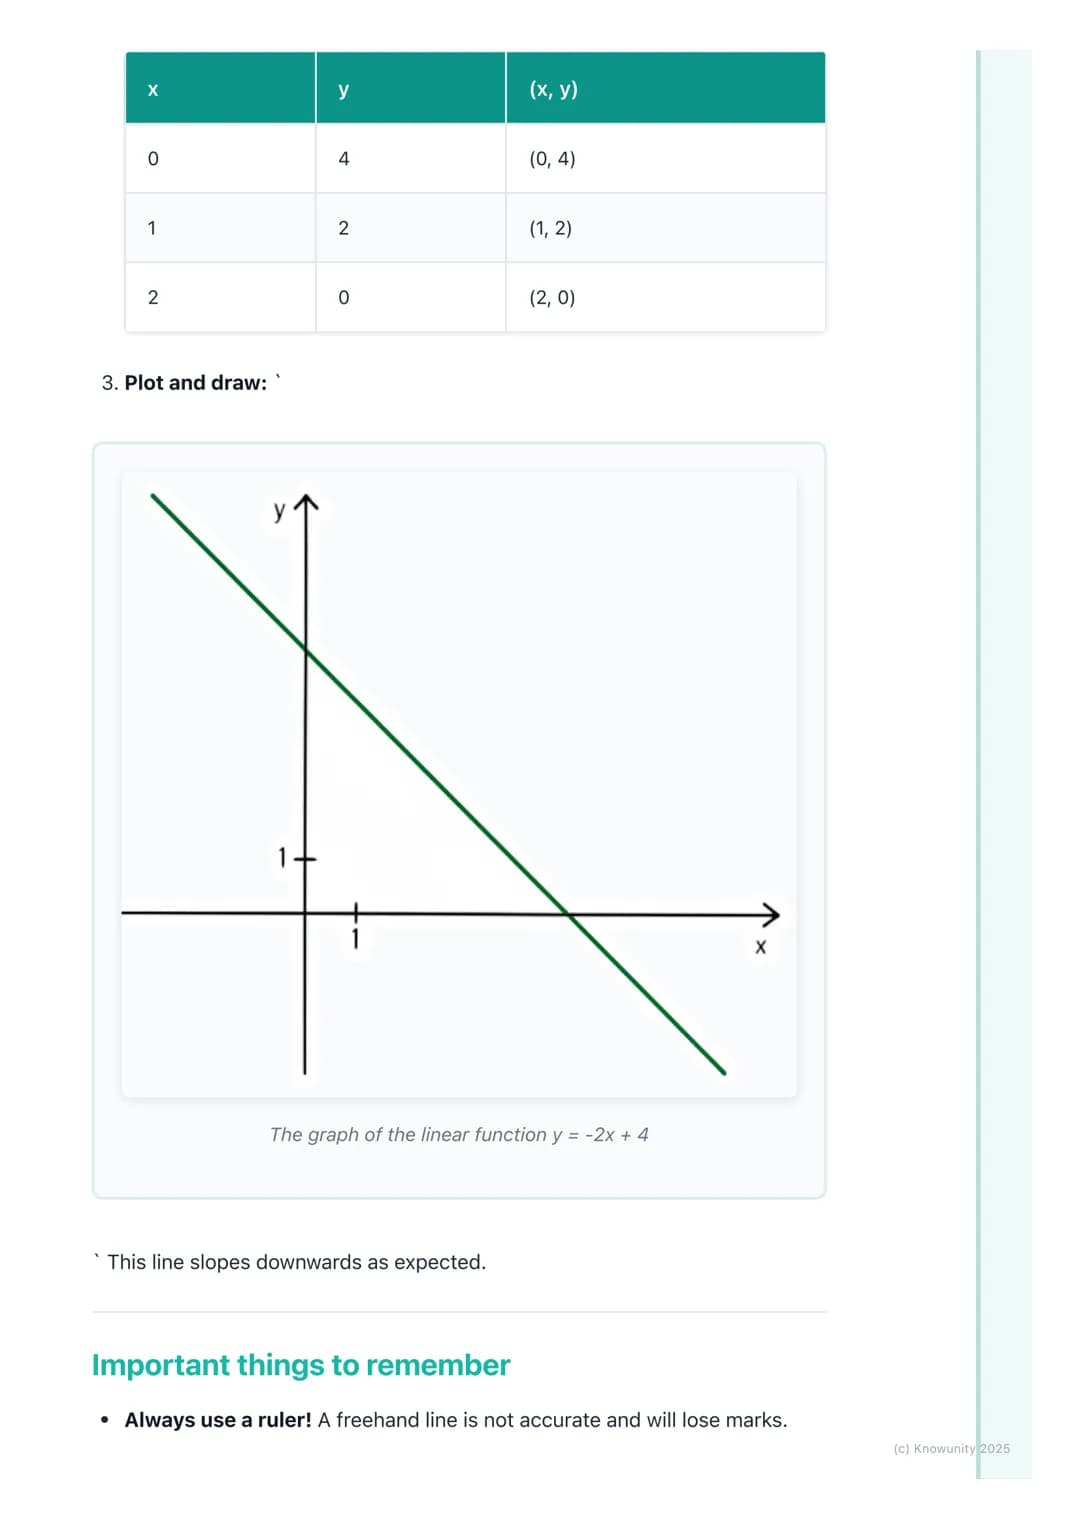
Worked Example: Negative Slope
Now let's try y = -2x + 4, which has a negative slope of -2. This means your line will slope downwards from left to right - quite dramatically because -2 is fairly steep. The y-intercept is 4.
Using x = 0, 1, and 2: When x = 0: y = -2(0) + 4 = 4. When x = 1: y = -2(1) + 4 = 2. When x = 2: y = -2(2) + 4 = 0. Your coordinates are (0, 4), (1, 2), and (2, 0).
Plot these points and draw your line. See how it slopes downward? For every step right, the line drops 2 steps down. This linear function creates a perfect straight line that behaves exactly as the equation predicts.
Pattern Spot: Notice how y decreases by 2 each time x increases by 1? That's your slope of -2 in action!
7
of 7
Exam Success Tips
Master these essentials and you'll smash any linear functions question. Always remember: y = mx + c where m is slope and c is y-intercept. Positive slopes go uphill, negative slopes go downhill. Simple!
Your foolproof method: create a table, pick 3-4 simple x-values, calculate y-values, plot coordinates, and join with a ruler. Label everything clearly - your axes, your line, and its equation. Teachers notice these details.
The y-intercept gives you a brilliant quick check. For y = 2x + 1, your line must cross the y-axis at 1. If it doesn't, you've made an error somewhere. Use this as your safety net in exams.
Exam Hack: If you're running short on time, just find the y-intercept and one other point. Two points are enough to draw the line, though three is always safer!
Pensavamo che non l'avreste mai chiesto....
Che cos'è l'assistente AI di Knowunity?
Il nostro assistente AI è costruito specificamente per le esigenze degli studenti. Sulla base dei milioni di contenuti presenti sulla piattaforma, possiamo fornire agli studenti risposte davvero significative e pertinenti. Ma non si tratta solo di risposte, l'assistente è in grado di guidare gli studenti attraverso le loro sfide quotidiane di studio, con piani di studio personalizzati, quiz o contenuti nella chat e una personalizzazione al 100% basata sulle competenze e sugli sviluppi degli studenti.
Dove posso scaricare l'applicazione Knowunity?
È possibile scaricare l'applicazione dal Google Play Store e dall'Apple App Store.
Knowunity è davvero gratuita?
Sì, hai accesso completamente gratuito a tutti i contenuti nell'app e puoi chattare o seguire i Creatori in qualsiasi momento. Sbloccherai nuove funzioni crescendo il tuo numero di follower. Inoltre, offriamo Knowunity Premium, che consente di studiare senza alcun limite!!
Contenuti più popolari di Mathematics
8Algebra
Algebra
5th Year91
Algebra 2
Algebra notes focusing on the factor theorem, completing the square, -b formula, graphs of polynomials
5th Year130
Solving Equations
This section focuses on solving one-step and two-step linear equations to find the value of an unknown variable.
1st Year131
Arithmetic sequences and series
With examples
5th Year130
Introduction to Probability
This topic introduces basic probability concepts, including calculating the probability of simple events and understanding the difference between experimental and theoretical probability.
2nd Year91
Maths jc algebra
Maths jc
1st Year230
Natural Numbers and Integers
Students will learn about positive whole numbers, zero, and negative whole numbers, and how to add, subtract, multiply, and divide them correctly.
1st Year131
Differential Calculus
Calculus is a topic that comes up nearly everywhere on your maths LC. This is just starter notes that could be useful end of 5th year or start of 6th year
5th Year271
Contenuti più popolari
9Irish oral questions and answers
Questions and answers for the leaving cert oral
5th Year4264
Key Quotes : Sive
Key Quotes and explanations: Sive
6th Year2842
Irish oral questions
Outline of oral questions
5th Year2055
Iníon- le hÁine Durkin
Aine Durkin’s poem, Iníon: Themes & summary
5th Year890
Irish poetry 2027
Iníon + Dínit an Bhróin
5th Year1153
LC HL notes- Iníon (poem)
Includes poem in English and Irish, theme, key words & phrases
5th Year2304
Cultural Context : Shawshank Redemption : Sive : Small Things Like These
Comparative Study : Cultural Context : Shawshank Redemption, Sive and Small Things Like These
6th Year1430
Mo Ghrá-sa (Idir Lúibíní)
Notes on mo ghrá-sa
5th Year380
An Gaeilge Aiste
Irish Language essay
6th Year1320
Non c'è niente di adatto? Esplorare altre aree tematiche.
Recensioni dei nostri utenti. Ci adorano - e anche tu, vedrai .
4.6/5App Store
4.7/5Google Play
L'applicazione è molto facile da usare e ben progettata. Finora ho trovato tutto quello che cercavo e ho potuto imparare molto dalle presentazioni! Utilizzerò sicuramente l'app per i compiti in classe! È molto utile anche come fonte di ispirazione.
Stefano Sutente iOS
Questa applicazione è davvero grande! Ci sono tantissimi appunti e aiuti con lo studio [...]. La mia materia problematica, per esempio, è il francese e l'app ha così tante opzioni per aiutarmi. Grazie a questa app ho migliorato il mio francese. La consiglio a tutti.
Samantha Klichutente Android
Wow, sono davvero stupita. Ho appena provato l'app perché l'ho vista pubblicizzata molte volte e sono rimasta assolutamente sbalordita. Questa app è L'AIUTO che cercate per la scuola e soprattutto offre tantissime cose, come allenamenti e schede, che a me personalmente sono state MOLTO utili.
Annautente iOS
Exploring Linear Functions: Graphing and Relationships
Linear functions are everywhere around you - from calculating your mobile phone bill to tracking how fast you're cycling. They create perfect straight lines when graphed and follow predictable patterns that make maths much easier once you get the hang...
1
of 7
Iscriviti per mostrare il contenuto. È gratis!
- Accesso a tutti i documenti
- Migliora i tuoi voti
- Unisciti a milioni di studenti
Understanding Linear Functions
Think of a linear function as a mathematical rule that always creates a straight line when you plot it on a graph. The clue's in the name - "linear" comes from "line"! These functions show how two things are connected in a steady, predictable way.
The magic formula you need to master is y = mx + c. This might look intimidating at first, but it's actually your best friend for understanding how lines work. Every linear function can be written this way.
You'll also need to get comfortable with some key vocabulary. A function is simply a rule that takes one number (x) and gives you exactly one answer (y). Variables are the letters (like x and y) that can change, while constants are the numbers that stay the same. Coordinates are pairs of numbers like (3, 4) that tell you exactly where to put a point on your graph.
Quick Tip: Remember coordinates as "across the hall, then up the stairs" - go across the x-axis first, then up or down the y-axis!
2
of 7Iscriviti per mostrare il contenuto. È gratis!
- Accesso a tutti i documenti
- Migliora i tuoi voti
- Unisciti a milioni di studenti
The Two Most Important Parts
Every linear equation has two crucial components that control how your line looks. The slope (m) tells you how steep your line is - it's like the angle of a ramp. If m = 2, your line goes up 2 units for every 1 unit it goes across. Pretty straightforward!
The y-intercept (c) is where your line crosses the vertical y-axis. If c = 3, you know your line will pass through the point (0, 3) every single time. This gives you an instant starting point for drawing your graph.
Understanding these two parts means you can look at any equation like y = 2x + 1 and immediately know: "This line has a slope of 2 and crosses the y-axis at 1." You're already halfway to drawing the perfect graph!
Remember: Positive slopes go uphill from left to right, negative slopes go downhill. It's that simple!
3
of 7Iscriviti per mostrare il contenuto. È gratis!
- Accesso a tutti i documenti
- Migliora i tuoi voti
- Unisciti a milioni di studenti
Creating Your Table of Values
Here's where the real work begins, but don't worry - it's just following a recipe. Start with your linear function in the form y = mx + c. Let's use y = 2x + 1 as our example.
Your mission is to find at least three points that lie on this line. Pick simple x-values like -1, 0, 1, and 2 to make your calculations easy. Nobody wants to work with horrible fractions when they don't have to!
Now substitute each x-value into your equation. When x = 0: y = 2(0) + 1 = 1. When x = 1: y = 2(1) + 1 = 3. When x = 2: y = 2(2) + 1 = 5. See the pattern? Your y-values are increasing by 2 each time because your slope is 2.
Pro Tip: If your three points don't line up perfectly when you plot them, check your maths - one of your calculations has gone wrong!
4
of 7Iscriviti per mostrare il contenuto. È gratis!
- Accesso a tutti i documenti
- Migliora i tuoi voti
- Unisciti a milioni di studenti
Plotting and Drawing Your Graph
Time to bring your calculations to life! Draw your axes with a ruler , label them clearly, and don't forget those arrows on the ends. Your Cartesian plane should look professional.
Plot each coordinate pair from your table carefully. For (-1, -1), go 1 unit left and 1 unit down from the origin. For (0, 1), stay on the y-axis and go 1 unit up. For (1, 3), go 1 unit right and 3 units up.
Once all your points are marked, use your ruler to draw one straight line through them all. Extend the line beyond your points with arrows to show it continues forever. Label your line with its equation - teachers love to see this attention to detail.
Golden Rule: Three points minimum! Two points make a line, but the third point proves you haven't made any mistakes.
5
of 7Iscriviti per mostrare il contenuto. È gratis!
- Accesso a tutti i documenti
- Migliora i tuoi voti
- Unisciti a milioni di studenti
Worked Example: Positive Slope
Let's tackle y = x + 3 step by step. This linear function has a slope of 1 (remember, x means 1x) and a y-intercept of 3. So you know it goes up gently and crosses the y-axis at 3.
Choose x = -2, 0, and 2 for easy calculations. When x = -2: y = (-2) + 3 = 1. When x = 0: y = (0) + 3 = 3. When x = 2: y = (2) + 3 = 5. Your coordinates are (-2, 1), (0, 3), and (2, 5).
Plot these points and connect them with a straight line. Notice how the line goes up from left to right? That's because your slope is positive. The line crosses the y-axis exactly where you predicted - at y = 3.
Check Yourself: Does your line pass through (0, 3)? If not, something's gone wrong with your plotting!
6
of 7Iscriviti per mostrare il contenuto. È gratis!
- Accesso a tutti i documenti
- Migliora i tuoi voti
- Unisciti a milioni di studenti
Worked Example: Negative Slope
Now let's try y = -2x + 4, which has a negative slope of -2. This means your line will slope downwards from left to right - quite dramatically because -2 is fairly steep. The y-intercept is 4.
Using x = 0, 1, and 2: When x = 0: y = -2(0) + 4 = 4. When x = 1: y = -2(1) + 4 = 2. When x = 2: y = -2(2) + 4 = 0. Your coordinates are (0, 4), (1, 2), and (2, 0).
Plot these points and draw your line. See how it slopes downward? For every step right, the line drops 2 steps down. This linear function creates a perfect straight line that behaves exactly as the equation predicts.
Pattern Spot: Notice how y decreases by 2 each time x increases by 1? That's your slope of -2 in action!
7
of 7Iscriviti per mostrare il contenuto. È gratis!
- Accesso a tutti i documenti
- Migliora i tuoi voti
- Unisciti a milioni di studenti
Exam Success Tips
Master these essentials and you'll smash any linear functions question. Always remember: y = mx + c where m is slope and c is y-intercept. Positive slopes go uphill, negative slopes go downhill. Simple!
Your foolproof method: create a table, pick 3-4 simple x-values, calculate y-values, plot coordinates, and join with a ruler. Label everything clearly - your axes, your line, and its equation. Teachers notice these details.
The y-intercept gives you a brilliant quick check. For y = 2x + 1, your line must cross the y-axis at 1. If it doesn't, you've made an error somewhere. Use this as your safety net in exams.
Exam Hack: If you're running short on time, just find the y-intercept and one other point. Two points are enough to draw the line, though three is always safer!
Pensavamo che non l'avreste mai chiesto....
Che cos'è l'assistente AI di Knowunity?
Il nostro assistente AI è costruito specificamente per le esigenze degli studenti. Sulla base dei milioni di contenuti presenti sulla piattaforma, possiamo fornire agli studenti risposte davvero significative e pertinenti. Ma non si tratta solo di risposte, l'assistente è in grado di guidare gli studenti attraverso le loro sfide quotidiane di studio, con piani di studio personalizzati, quiz o contenuti nella chat e una personalizzazione al 100% basata sulle competenze e sugli sviluppi degli studenti.
Dove posso scaricare l'applicazione Knowunity?
È possibile scaricare l'applicazione dal Google Play Store e dall'Apple App Store.
Knowunity è davvero gratuita?
Sì, hai accesso completamente gratuito a tutti i contenuti nell'app e puoi chattare o seguire i Creatori in qualsiasi momento. Sbloccherai nuove funzioni crescendo il tuo numero di follower. Inoltre, offriamo Knowunity Premium, che consente di studiare senza alcun limite!!
Contenuti più popolari di Mathematics
8Algebra
Algebra
5th Year91
Algebra 2
Algebra notes focusing on the factor theorem, completing the square, -b formula, graphs of polynomials
5th Year130
Solving Equations
This section focuses on solving one-step and two-step linear equations to find the value of an unknown variable.
1st Year131
Arithmetic sequences and series
With examples
5th Year130
Introduction to Probability
This topic introduces basic probability concepts, including calculating the probability of simple events and understanding the difference between experimental and theoretical probability.
2nd Year91
Maths jc algebra
Maths jc
1st Year230
Natural Numbers and Integers
Students will learn about positive whole numbers, zero, and negative whole numbers, and how to add, subtract, multiply, and divide them correctly.
1st Year131
Differential Calculus
Calculus is a topic that comes up nearly everywhere on your maths LC. This is just starter notes that could be useful end of 5th year or start of 6th year
5th Year271
Contenuti più popolari
9Irish oral questions and answers
Questions and answers for the leaving cert oral
5th Year4264
Key Quotes : Sive
Key Quotes and explanations: Sive
6th Year2842
Irish oral questions
Outline of oral questions
5th Year2055
Iníon- le hÁine Durkin
Aine Durkin’s poem, Iníon: Themes & summary
5th Year890
Irish poetry 2027
Iníon + Dínit an Bhróin
5th Year1153
LC HL notes- Iníon (poem)
Includes poem in English and Irish, theme, key words & phrases
5th Year2304
Cultural Context : Shawshank Redemption : Sive : Small Things Like These
Comparative Study : Cultural Context : Shawshank Redemption, Sive and Small Things Like These
6th Year1430
Mo Ghrá-sa (Idir Lúibíní)
Notes on mo ghrá-sa
5th Year380
An Gaeilge Aiste
Irish Language essay
6th Year1320
Non c'è niente di adatto? Esplorare altre aree tematiche.
Recensioni dei nostri utenti. Ci adorano - e anche tu, vedrai .
4.6/5App Store
4.7/5Google Play
L'applicazione è molto facile da usare e ben progettata. Finora ho trovato tutto quello che cercavo e ho potuto imparare molto dalle presentazioni! Utilizzerò sicuramente l'app per i compiti in classe! È molto utile anche come fonte di ispirazione.
Stefano Sutente iOS
Questa applicazione è davvero grande! Ci sono tantissimi appunti e aiuti con lo studio [...]. La mia materia problematica, per esempio, è il francese e l'app ha così tante opzioni per aiutarmi. Grazie a questa app ho migliorato il mio francese. La consiglio a tutti.
Samantha Klichutente Android
Wow, sono davvero stupita. Ho appena provato l'app perché l'ho vista pubblicizzata molte volte e sono rimasta assolutamente sbalordita. Questa app è L'AIUTO che cercate per la scuola e soprattutto offre tantissime cose, come allenamenti e schede, che a me personalmente sono state MOLTO utili.
Annautente iOS